On the perils of extrapolationlocal regression
07 Dec 2013
The Bureau of Labor Statistics released the jobs’ numbers for the month of November and many were pleased to see the unemployment rate fall from 7.3% to 7.0%. This was seen by many as positive news and the stock market jumped as a result.
However, not everyone viewed the news through rose colored glasses.
The chart that will make you worry about the labor market. pic.twitter.com/S25cSyEwhx
— Justin Wolfers (@JustinWolfers) December 6, 2013
He makes an important point: we shouldn’t consider the jump from October to November that meaningful given that the labor market was highly distorted by the government shutdown that lasted the first two weeks of that month. By showing that employment actually dipped from September to November (according to “the household adjustment survey data adjusted to a payroll concept”), he implies that we should be actually quite worried about the labor market.
After seeing this tweet, I set out to see if a longer pattern in the data match corroborate his conclusion. To do this, I downloaded the past 5 years of civilian employment data* from the FRED database and fit two loess (aka local regression) curves. The first (in blue) has a span* of 1/5, while the second (in dark green) had a span of 2/5. Otherwise, the two are identical.
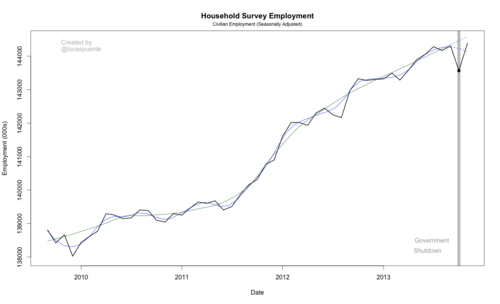
This subtle difference turns out to be pretty important in evaluating the November jobs report. By fitting the blue loess curve to the previous 60 months of data (September 2009 - September 2013), we predict employment of 144,127,300. Our predict using the red loess curve is 144,592,200, a difference of 464,900 jobs. Perhaps more importantly, the blue curve says the labor market is out performing our expectations, while the red curve says the opposite. This important difference can be solely attributed to seems like an unimportant or minor modeling choice. This is an lesson for all of us working in data science to remember when interpreting data.
*This data set is close but not identical to the one Wolfers uses. I was unable to find the exact data set that he did.
**The span is also known as the smoothing parameter and is represented by alpha in regression equations. A larger alpha corresponds to fewer local regressions being run, while a smaller alpha uses fewer data points to construct the smoothing curve. When alpha is equal to one (the upper bound) the loess is identical to a standard linear regression.


Site Design: jmcglone ![]()